Difference between revisions of "ABM"
(Created page with "===NetLogo=== The SimCo framework was programmed in NetLogo (Wilensky 1999), a frequently used software for designing sociological experiments by means of ABM. Compared to oth...") |
|||
| Line 11: | Line 11: | ||
Besides, we collect many data from test runs like information on agents’ choices, nodes’ and edges’ state variables as well as a history of controlling interventions. | Besides, we collect many data from test runs like information on agents’ choices, nodes’ and edges’ state variables as well as a history of controlling interventions. | ||
| + | |||
| + | TEST | ||
=== Interface === | === Interface === | ||
Typically, a set number of experiments will be run without any user interface and will therefore generate output data automatically. The model was also implemented to be run in GUI mode in order to conduct experiments with human probands, who can control the system and intervene, if necessary. | Typically, a set number of experiments will be run without any user interface and will therefore generate output data automatically. The model was also implemented to be run in GUI mode in order to conduct experiments with human probands, who can control the system and intervene, if necessary. | ||
: Go to the next page: [[Experiments]] | : Go to the next page: [[Experiments]] | ||
Revision as of 09:46, 28 March 2023
NetLogo
The SimCo framework was programmed in NetLogo (Wilensky 1999), a frequently used software for designing sociological experiments by means of ABM. Compared to other models from sociology SimCo differs with regard to the fact that edges do not connect nodes virtually, but have a spatial dimension and other features such as carrying capacity. Agents, which traverse edges, need time to perform this action and interact with them in various ways – similar to the agent-patch interaction in NetLogo.
Scenario generator
A separate NetLogo model facilitates setting up scenarios. It allows users to choose from a predefined set of nodes, edges, agents and technologies, save this configuration as a master file.
Output
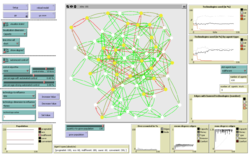
SimCo contains some basic plots in its graphical user interface, showing for example the proportion of technologies used as a percentage, or the number of agents unable to move due to local restrictions. The main visualization shows the graph and, colorized, its state with regard to different “dimensions” specified in the scenario.
Besides, we collect many data from test runs like information on agents’ choices, nodes’ and edges’ state variables as well as a history of controlling interventions.
TEST
Interface
Typically, a set number of experiments will be run without any user interface and will therefore generate output data automatically. The model was also implemented to be run in GUI mode in order to conduct experiments with human probands, who can control the system and intervene, if necessary.
- Go to the next page: Experiments
