Decision Making
Decision Algorithm
Staying with the example of transportation, user agents move through the network, which both enables and constrains their actions, in order to fulfil their tasks. They select edges that lead to nodes with a high utility when taking their decision, using technologies that fit their interests best.
SEU
Utilizing the concept of subjective expected utilities (SEU), action alternatives may be calculated by the following formula, including action alternatives (A), the valuation (U) of expected outcomes (O) and the expected probability (p) of achieving a goal (O) by taking an action (A):
In our adaptation of the SEU-model, the probabilities (p-values) are not fixed but based on situational factors (current financial resources of the respective agent, traffic situation etc.) as well as on transport mode characteristics.
Macro-micro-macro model
Agents are designed according to sociological theory of action. In modelling decision making, we lean on the “model of sociological explanation” (MSE) by Hartmut Esser (1993), which explains structural dynamics of social systems by means of a macro-micro-macro model similar to Coleman’s “boat” (1990). This model describes system dynamics as the emergent result of actors’ interactions (micro-macro link), which on their part are constrained by the current state of the system (macro-micro link).
First Loop: Agent's Routine Choices
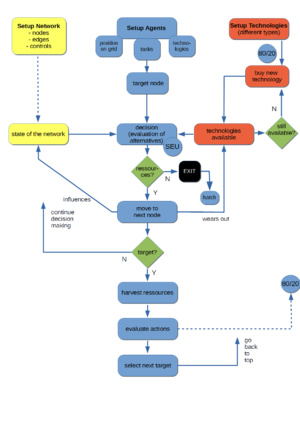
Agents start their journeys at their respective home node, referring to an ordered task list (such as kindergarten, work, shopping, home). As depicted in the flow chart of agent's choices in blue colours, they first select the next target node and then make a decision to which node to go next. Taking into consideration their individual preferences, they choose one of several alternatives available that fits best their interests.
Selection of alternatives
If for example two follow-on nodes can be reached by means of two technologies, four alternatives open up via combinatorial logic. The value of each alternative depends on the costs and benefits of the respective node, which may change through sociotechnical interactions
Learning mechanism
There is also a learning mechanism at the level of the whole population: Agents that lack resources for performing actions will die, and a new agent with the properties of one of the remaining agents will hatch automatically. In the long run, successful types of agents will thus prevail.
- For more details see papers.
Second loop: Replacement of technology
If the technologies available to the agent have reached their lifetime limit and are worn-out, they have to be replaced (see flow chart, red colours).
Purchase decisions
For modelling these purchase decisions, we use a provisional eighty-twenty-rule: In 80 per cent of all cases agents purchase the most successful technology, i.e. the one they selected mostly in their daily choices.
However, in 20 per cent of all cases, they choose a technology, they didn’t possess before, making a step-by-step replacement of old technologies possible, if successful.
Third loop: System management
The operators monitor the state of the network and intervene if certain limits are exceeded, typically based on a political decision to operate the system within defined limits (e.g. pollution, congestion).
Operators evaluate the system’s performance and adjust parameters of different “dimensions”. By this way they indirectly affect agents’ decision making by changing the boundary conditions. Different modes of governance (see Experiments) may be applied here.
- Go to the next page: ABM

